
Word Games
Boxplots Definition
a simple way of representing statistical data on a plot in which a rectangle is drawn to represent the second and third quartiles, usually with a vertical line inside to indicate the median value. The lower and upper quartiles are shown as horizontal lines either side of the rectangle
- Words with K And V In Them
- Six Letter Words That Start with E
- Words with Z And X
- Words with F
- Words with J And Z
- 5 Letter Words Beginning with H
- Words with Z And V
- 6 Letter Words Starting with A
- Seven Letter Word That Starts with A
- Word with Z And H
- 3 Letter Words with V
- Words with Z And B
- Y Words
- Nine Letter Words
- Five Letter Words with X
- Words That End In Na
- Words That End with H
- Three Letter Words That Start with R
- Words with T And A
- Words That End with Uz
- 7 Letter Word Starting with E
- 8 Letter Word Finder
- 5 Letter Word Beginning with X
- Five Letter Words with N
- Words Ending In Qat
- Words Ending In He
- Words Ending Ik
- Words That End In Sc
- Five Letter Words with Z
- Words That End with Sox
Connections NYT: Hints For Today's Puzzle, Tue, Jan 13

NYT Strands Today - Hints, Spangram & Answers for January 13
Today’s Wordle Answer Jan 13 #1669- NYT Wordle Hints & Updates
Today's NYT Pips Hints & Answers
Today's NYT Capture Hints & Answers
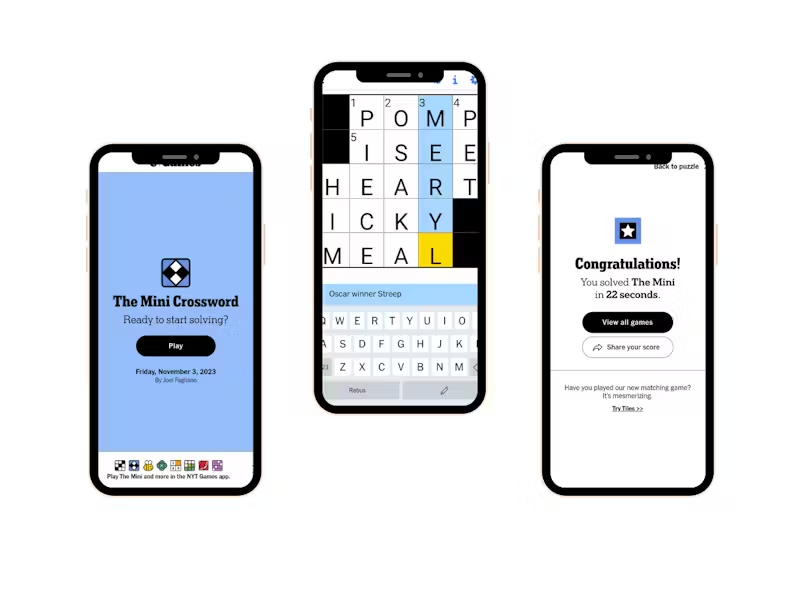
NYT Mini Crossword Answers Today - The Mini for Jan 13 Solved
- 5 Letter Words That Start with C
- Words with S And J
- 4 Letter Word Ending In A
- Words with Z And T
- Words with S And Z
- Words with Q And Y
- Words with K And Q
- Words with V And K
- Q Words Ending In B
- Words with 2 V's
- Words with J And F
- Words That End In C
- 2 Letter Words with J
- Word with B And Z
- Words with Two Y's
- Words with Lei
- Words That Begin with Gl
- Three Letter Words That Start with B
- 7 Letter Words Starting with M
- Words That End with Er
- 6 Letter Word Starting with C
- 8 Letter Word Tips
- 8 Letter Words Starting with K
- Words That Start with Sm
- 8 Letter Words That Start with T
- Words That Start with P And End with D
- Baz Word
- Words with K And T In Them
- Words Ending In Ava
- Seven Letter Words Starting with C
Connections NYT: Hints For Today's Puzzle, Tue, Jan 13
NYT Strands Today - Hints, Spangram & Answers for January 13
Today’s Wordle Answer Jan 13 #1669- NYT Wordle Hints & Updates
Today's NYT Pips Hints & Answers
Today's NYT Capture Hints & Answers
NYT Mini Crossword Answers Today - The Mini for Jan 13 Solved